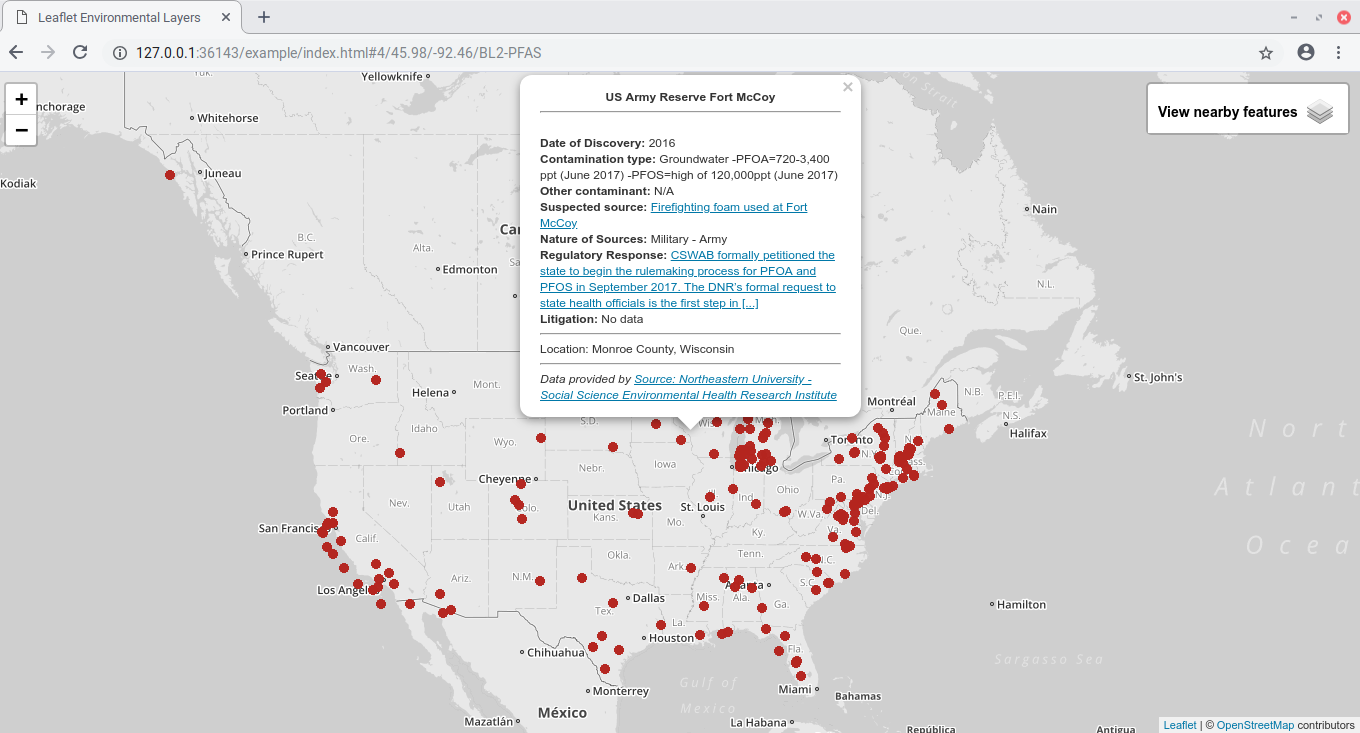
I wanted to practice using more JS and mapping so I decided to try to add a layers to Public Lab’s Leaflet Environmental Layers Map which is a project that shows various environmental and demographic data all on one convenient map using the Leaflet.js library. I like it because having a map where anyone can toggle on and off the various layers allows a person to overlay data and see trends they otherwise would have a tough time seeing.
I decided to work on adding a PFAS layer to the map. PFAS stand for Per- and Polyfluoroalkyl Substances, which are persistent environmental pollutants or as the EPA site describes them:
chemicals are persistent, and resist degradation in the environment. They also bioaccumulate, meaning their concentration increases over time in the blood and organs. At high concentrations, certain PFAS have been linked to adverse health effects in laboratory animals that may reflect associations between exposure to these chemicals and some health problems such as low birth weight, delayed puberty onset, elevated cholesterol levels, and reduced immunologic responses to vaccination.
For more about PFAS and proposed safer alternatives Green Science Policy has some good background and proposals.
The Process (Part 1)
To add a layer to the leaflet-environmental-layers I figured I needed the latitude and longitude of the sites of contamination.
The first issue I had was that the data was write protected, meaning I could not modify it and hence use their google sheet to put in the latitude and longitude, so I made a copy of their data on my own account.
To get this I looked up ‘geocode’ and came across a whole slew of proprietary and pay for services to accomplish this goal. Since the data was in a google excel like sheet I did find a script to convert the location into lat/lng. The problem was that the location column had county or city and state data which isn’t the most precise piece of data I had for figuring out lat/lng. The first column in the data is the common name for the contamination site. I decided this alongside the location column was probably what I should use to figure out the lat/lng.
I found the csvgeocode npm module helpful in extracting the data. One note though is you do need an google API key and have to enable geocoding on it for the tool to work. It can be used as a simple command line tool to take in the csv file and output it to another csv file.
Data
- Original PFA Data via Northeastern SSEHRI PFAS Contamination Site Tracker
- The modified PFA data that includes lat/lng
I also looked through the EWG source code and found a couple geojson files which can be used. One is the same PFAS data that needs to be geocoded, so I ‘ve already done that above (PFAS geojson file)
- The other is the EPA tap water detections geojson file which can be incorporated into the map.